Newsletter #13
Sapidyne Mission Statement
To provide accurate, reliable, and sensitive measurement instrumentation and data. To acknowledge our limits, act with integrity, and strive together with our peers and customers to advance scientific discovery.
Publication Spotlight
Determining the affinities of high-affinity antibodies using KinExA and surface plasmon resonance
M. Frank Erasmus (a), Molly Downer (b), Fortunato Ferraraa (a), Sara D’Angelo, Andre A. Teixeira (a), Camila Leal-Lopes (a), Laura Spector (a), Elizabeth Hopkins (b), and Andrew R. M. Bradbury (a)
(a) Specifica, LLC, a Q2 Solutions Company, Santa Fe, NM, USA; (b) Sapidyne, Inc., Boise, ID, USA
ABSTRACT
Accurate and efficient affinity measurement techniques are essential for the biophysical characterization of therapeutic monoclonal antibodies, one of the fastest growing drug classes. Surface plasmon resonance (SPR) is widely used for determining antibody affinity, but does not perform well with extremely high affinity (low picomolar to femtomolar range) molecules. In this study, we compare the SPR-based Carterra LSA and the kinetic exclusion assay (KinExA) for measuring the affinities of 48 antibodies generated against the SARS-CoV-2 receptor-binding domain. These data reveal that high-affinity antibodies can be generated straight from selections using high-quality in vitro library platforms with 54% correspondence between affinities measured using LSA and KinExA. Generally, where there was a 2-fold or greater difference between LSA and KinExA, KinExA reported that affinities were tighter. We highlight the differences between LSA and KinExA, identifying the benefits and pitfalls of each in terms of dynamic range and throughput. Furthermore, we demonstrate for the first time that single-point screening with KinExA can significantly improve throughput while maintaining a strong correlation with full binding curve equilibrium measurements, enabling the accurate rank-ordering of clones with exceptionally tight binding properties.
KinExA Mode Test
Being “in the KinExA Mode” means there is not significant competition occurring and the signal is proportional to the free constant binding partner (CBP) in the sample. If the system is out of the KinExA Mode, the solid phase captures not only free CBP but CBP that was complexed with the titrant. Consequently a higher signal, and thus an inaccurate percent free CBP will be reported. Measurements conducted under these conditions will cause the Kd to appear weaker than it actually is. Read TN221 for more information. This guide will explain how to perform a KinExA Mode Test when needed. Consider conducting a KinExA Mode test if preliminary Range Find results indicate a Kd weaker than single digit nanomolar.
Because the signal will change with each flow rate, a Sig100 and NSB will need to be run to calculate the percent free for each flow rate. For the inhibited point select a titrant concentration that results in nearly 50% free CBP. For each flow rate calculate the percent free for the inhibited point using the following formula:
[Percent free] = ((Signal-NSB)/(Sig100-NSB)) x 100
Equation 1.
Selecting the 50% Inhibited Point
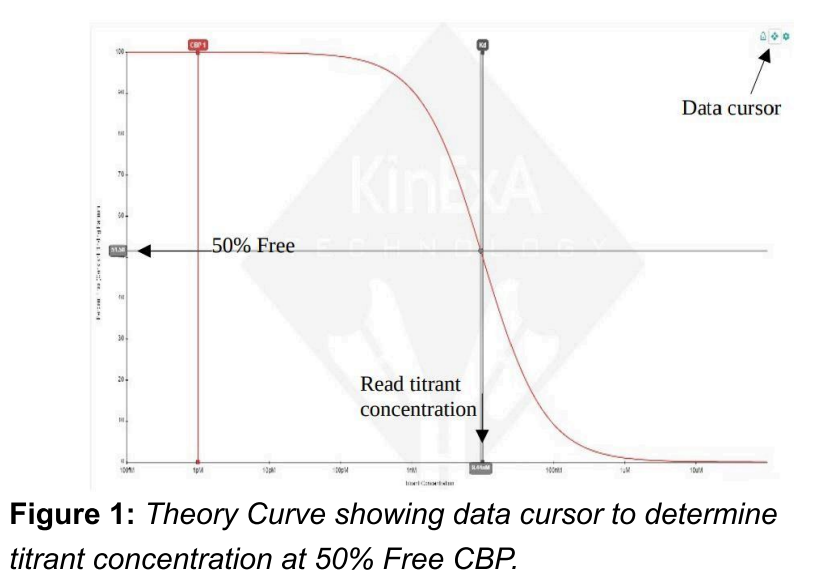
The titrant concentration that yields a 50% Free CBP point can be found using the Theory Curve or from the Range Find experiment. Follow the y-axis down until you reach the 50%free CBP point then follow the point across to the best fit curve. Drop the point from the curve to the titrant concentration on the x-axis. Read the titrant concentration from the x-axis. The Theory Curve has a data cursor in the top right corner. The data cursor may make it easier to find the titrant concentration along the x-axis (Figure 1).
Preparing the Experiment
Prepare enough sample to run all of the experiments out of the same sample tubes. When the flow rate doubles the sample volume needed also doubles, for example:
| Sample Volume | Flow Rate |
|---|---|
| 500 μL | 0.25 mL/min |
| 1000 μL | 0.50 mL/min |
| 2000 μL | 1.00 mL/min |
| 4000 μL | 2.00 mL/min |
Choose at least two different flow rates to determine if you are out of KinExA Mode. More points may be needed to determine which flow rate is required to be in KinExA Mode. For example, to run an experiment at 0.25 mL/min and 1.00 mL/min the volume required is 2500 μL + dead volume (DV) = 2700μL/point.
To ensure the entire sample flows over the flow cell at a constant rate, the flow rate for the Buffer step after the sample draw must be adjusted to match the flow rate of the sample draw (Figure2.) Notice as the Rate increases the Volume automatically adjusts to the volume required. The Rate for the label draw does not need to be changed.
Run each flow rate as its own experiment from the same sample tubes.
Calculate the Percent Free CBP using Equation 1 for each flow rate. You need to run faster flow rates until the % Free CBP stops changing.
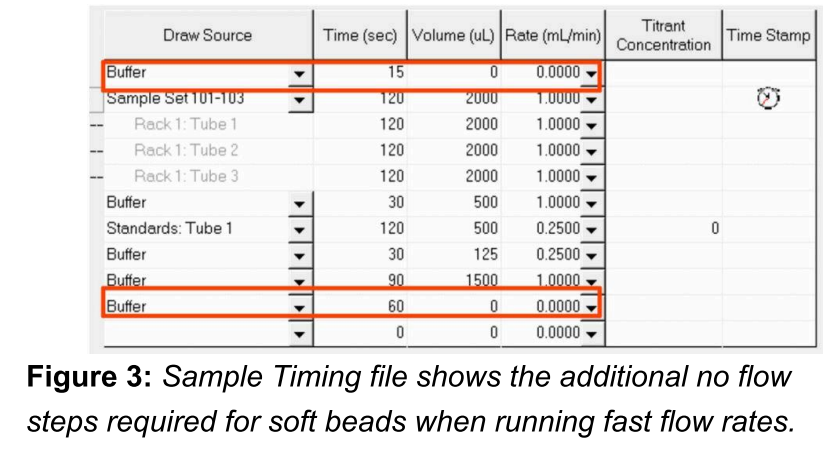
Note: When using soft beads (eg. Azlactone) include 15seconds of no flow at the beginning of the sample run, and 60 seconds at the end of the last wash step. This allows the soft beads to expand to their normal volume(flow compresses them) before the signal is calculated (Figure 3).
Olive Oil Taste Test

At a recent corporate gathering, employees of Sapidyne participated in an Olive Oil Taste Test, adding a flavorful twist to their event agenda. The blind tasting session featured a selection of renowned brands, each accompanied by its respective price point:
- Pompeian – $6
- Kroger – $10
- Trader Joe’s – $12
- Lucini – $32
- Laudemio – $45
Utilizing French bread as their tasting canvas, participants meticulously assessed each oil, ranking them based on flavor profile and overall satisfaction. To the surprise of many, Kroger emerged as the unexpected victor, garnering the highest acclaim for its taste and quality. In contrast, Laudemio, despite its premium price tag, found itself in the fifth position, largely attributed to its pronounced and polarizing flavor intensity.
Idaho Science News Spotlight
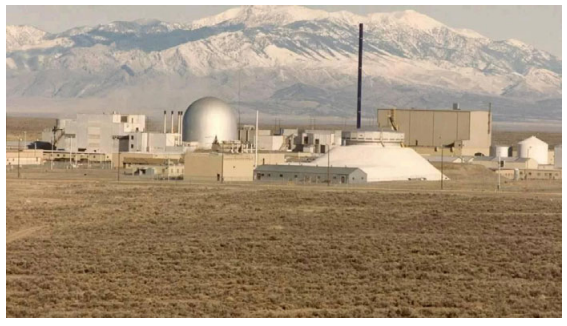
With the help of strong partnerships, nuclear cleanup milestones & research advance
By: John Wagner, Idaho Statesman
For many years, Idaho State officials have worked with the federal government to address complex issues in connection to the nuclear waste through the 1995 Settlement Agreement. Simultaneously, collaboration with the U.S. Department of Energy has transformed the Idaho National Laboratory (INL) into a research powerhouse with a significant economic impact. Recent achievements include surpassing a milestone in treating liquid sodium-bearing waste, showing progress in waste management. Idaho Governor Brad Little highlights the importance of upholding commitments to clean up the INL site. Hitting this milestone allows the INL to advance its nuclear energy mission, conducting research that is vital for the development of new reactors to meet global carbon reduction goals. Idaho’s dedication to responsible cleanup and support for INL’s mission is evident, marking a significant point in the state’s history as INL is approaching its 75th anniversary this year. In the coming years INL will operate the first novel reactors on site in half a century.