Newsletter #1

Maintaining the KinExA Instrument
If the instruments are left for long periods of time with 1X PBS or other buffers in the lines, salt crystals or contamination may occur. The following schedule should help hinder contamination or the formation of salt crystals when using KinExA instruments:
Daily
- Use 0.02% sodium azide in running buffer, samples, labels, and particle reservoirs. While this will not completely eliminate the possibility of contamination, customers who use sodium azide regularly have far fewer problems with contamination.
Monthly
- Change the buffer and sterilize the buffer containers monthly or more frequently when contamination is suspected.
- Clean the injection syringe barrel at least once monthly. The injection syringe may get contaminated, clogged, or coated with label. The injection syringe should also be rinsed if a kinetics injection experiment is going to be performed. Rinsing with buffer alone may leave residual label in the injection syringe. For instructions about cleaning the injection syringe barrel, see How to Guide 211 (HG211).
Every 3 Months
- Perform an Extreme Clean at least once every three months or when contamination is suspected. An extreme clean uses both bleach and a surfactant solution, KinExA Cleaning Solution (Part #: 2T7010), to decontaminate and clean the instrument with a series of rinses. For the full extreme clean procedure, see HG202. For Autosampler extreme cleaning procedures, see HG201.
Idle Instruments
- Idle for ~1 month: Periodically run rinses to avoid crystal formation in the tubes.
- Idle for ~3 months: Remove the salt solution and fill the tubes with a dH2O and 0.02% sodium azide solution.
- Idle for more than 3 months: Rinse with dH2O solution, then remove all liquid from lines.
Spotlight
In a 2011 publication from Analytical Biochemistry, researchers exploited the Kinetic Exclusion Assay to accurately determine the affinity and kinetics for unpurified native antigens at relatively low concentrations. The standard KinExA format, commonly used to characterize solution antibody/antigen interactions, coats the ligand on the solid phase and uses the ligand as the concentration reference. Only small quantities of the antibody are needed and the antibody active concentration is determined.In this study, researchers used the reverse format in which the antibody was coated on the solid phase, reducing the amount of ligand needed for the experiment, and the ligand concentration was determined. Results showed that the affinity was the same whether the standard format or reverse format was used and regardless of the purity of the binding partner.
Kinetic analysis of unpurified native antigens available in very low quantities and concentrations. Palaniswami Rathanaswami, Karen Richmond, Kathy Manchulenko, Ian N. Foltz
Contact a Sapidyne representative if you would like more information on the reverse format or have questions regarding your particular system.
Ask the Inventor
 Two related questions that have arisen lately in conjunction with the time to reach equilibrium in KinExA studies are:
Question 1
Sapidyne recommends performing my ligand serial dilution in receptor solution. To begin, I add concentrated ligand to the first sample then mix and do the serial dilution. Doesn’t this mean it’s possible my first sample (high concentration) may mostly bind up and I then have to wait for the dissociation (which is slower than association) for the subsequent samples to equilibrate?
Question 2
Sapidyne recommends a large volume serial dilution strategy in which I serial dilute convenient small volumes, again in receptor, with much higher ligand, then when the serial dilution is done dilute all the samples with receptor to the final concentration and volume. Again, I’m diluting solutions that could easily be mostly bound so I have a longer wait for equilibrium, right?
Answer
The answer to both questions is: No.
Explanation
First it is important to acknowledge that the intuition behind these questions is correct. It does take longer to reach equilibrium if you start with more material bound than will be bound at equilibrium.
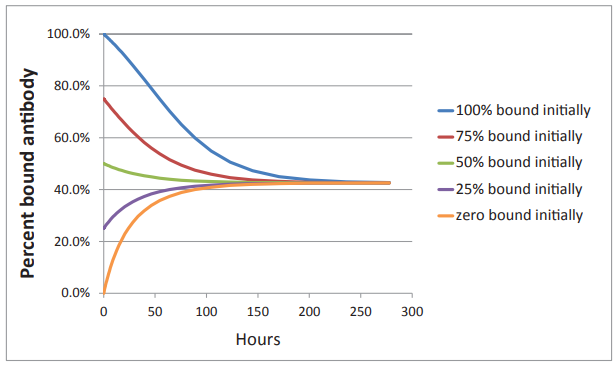
Figure 1. Time to reach equilibrium based on % bound.
The problem with Figure 1 is that it doesn’t apply to the questions at hand. The reason we don’t have to wait for dissociation is that under the conditions outlined we are always starting the incubation with less than the equilibrium concentration bound.

To understand why this is so, consider Figure 2 — a normal KinExA inhibition curve replotted on a linear x-axis. The particular curve shown is for a Kd of 1 pM and a receptor concentration of 0.1 pM and it shows the fraction of the total receptor that is free for the various concentrations of total ligand plotted on the x-axis. For example, at 30 pM total ligand the free fraction of the receptor is 0.032 or 3.2% of the total receptor.
If we take this particular sample and dilute it with an additional 0.1 pM receptor, then the receptor concentration is unchanged, but the free fraction and the total ligand concentration are both reduced. It is easy to show that the concentration of free receptor immediately after dilution lays on a straight line between the starting point and the end point (0,1). This makes sense intuitively — even if there is very little free receptor initially, if you add a very large volume of free receptor then the fraction of receptor free immediately after dilution approaches 1.
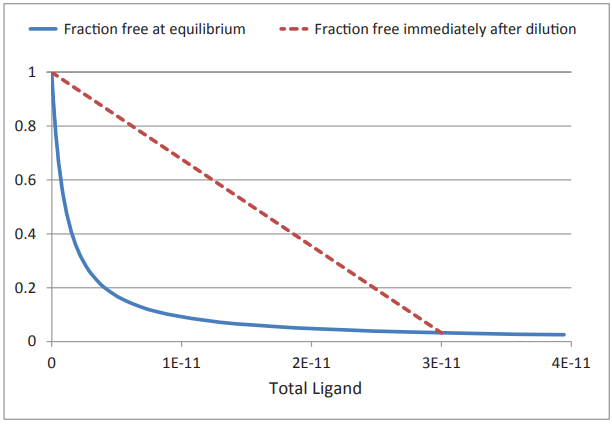
Since the total receptor concentration is not changed, the new equilibrium free fraction will lay on the same blue line at a point corresponding to the new (diluted) total ligand concentration. Immediately after dilution the free fraction will lay along the red line. After we dilute, the free fraction is too high and it has to move to a lower value to reach the new equilibrium. Because the free fraction is always hyperbolic and the dilution curve is always linear, we are guaranteed that the free fraction will always be too high. In order for the free fraction to decrease to its new equilibrium point, more receptor and ligand have to bind — and that is the reason we never have to wait for dissociation when preparing samples following the protocols outlined.
Elegant and simple once you grasp it, but is it satisfying? Do you need additional simulations including some time course data? If you’re interested, you can see a summary in Sapidyne Technology Note TN215.
Note: I thank Dr. Bob Blake for a fruitful and stimulating discussion that resulted in Figure 3 showing both the linear dilution and hyperbolic binding curve on the same axis.
A Standard Pressure Trace for the KinExA 3200
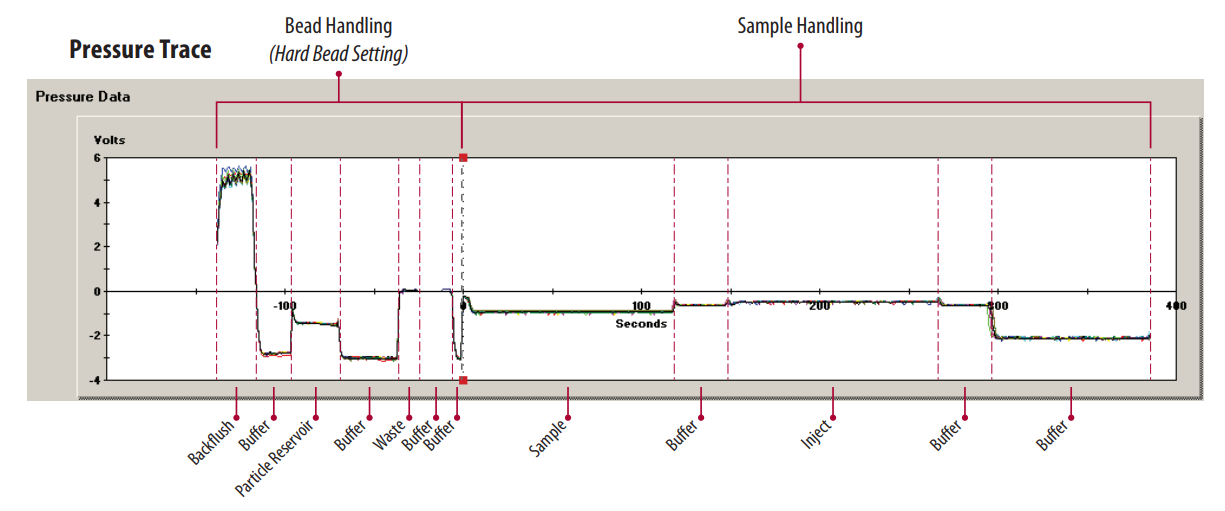
Figure 4. This pressure trace is for 13 samples run in duplicate. Each one of the pressure traces are reproducible and overlay nicely.
The pressure trace seen in Figure 4 was generated using the standard flow rates and volumes.
Bead Handling
Examining the pressure during the backflush may be useful when identifying potential problems. The pressure should stay between +5 and +9 V during the backflush. If an Autosampler is being used, the pressure should stay between +10 and +14 V. In either case, the pressure should be relatively constant during each backflush period.
- A decrease in positive pressure during backflush with a reproducible slant may be due to a clog in the backflush isolation valve. This can be flushed using a flush kit (Part #: 344345) and dH2O.
- An increase in positive pressure during backflush exceeding 9 V (or 14 V on the Autosampler) or a consistent increase over the course of an experiment could indicate that the flow cell should be replaced.
Sample Handling
Negative pressure for samples will be more or less negative depending on flow rate. If the flow rate is held constant throughout the experiment, then the pressure traces should overlay for multiple samples.
The pressure transducer has a finite life, and therefore is replaced during a preventive maintenance visit.
Erratic pressure sample handling traces are usually due to bubbles which may be introduced into the system in a variety of different ways. When bubbles are observed, check for the following:
- Buffer bottle, sample and label tubes, and the particle reservoir bottle have fluid.
- Buffer line and sample lines are at the bottom of the bottle or tubes.
- Timing File for the Autosampler went to the correct position.
- Tubing nuts are properly tightened and ferrules are correctly installed (especially after a flow cell change).
- A leak in the system (e.g. isolation valves, 4-way connector, sample selection valve, etc.).
For more information regarding pressure data, see TN214.