
Technology Note 211
Whole Cell Assay
The KinExA® instrument can be used to measure binding affinity of a soluble molecule to surface proteins of intact cells1,2. Here we provide an overview of the assay format, analysis, and considerations when performing cell based experiments.
Assay Format
Whole cells take the place of the soluble Titrant in a standard KinExA assay. Therefore, titrated cells are incubated with the constant binding partner (CBP). Once equilibrium is reached, the samples are centrifuged, the supernatants are recovered, and the free CBP is detected with a fluorescently labeled anti-CBP molecule (Figure 1). We do not run the cells through the instrument because they have been shown to clog the flow cell.
Unlike a soluble system, the supernatants do not contain bound or partially bound CBP so the signal is proportional to the completely free CBP instead of the free fraction of binding sites. The theory used in the analysis accounts for this difference by using the valency entered in the timing page of the experiment to adjust the theoretical calculations.
Because the supernatants only contain free CBP, the solid phase can be coated with any molecule that will detect the free CBP as long as it is not cross reactive with the label. For example, an anti-species antibody can be used to coat the beads which can be a significant benefit in cases where the membrane bound molecule is no longer active when removed from the membrane.
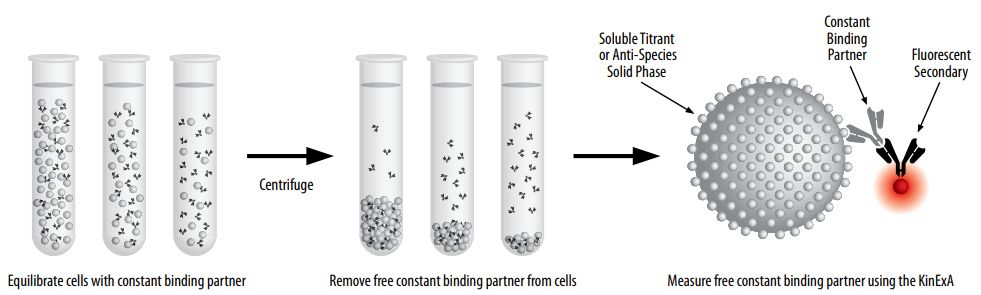
Figure 1. Illustration of whole cell setup.
Analysis
As always in KinExA analysis, the reference for concentration should be the binding partner in which the active concentration is more trusted. In a whole cell measurement, the molecular concentration of the surface expressed molecule is the product of the cells per mL, and the molecules per cell (Equation 1), which often has greater uncertainty than the CBP. For this reason most whole cell measurements use the constant partner as the concentration reference.
Molar Equivalent Concentration = (Cells/mL) × (1000 mL/L) × (Molecules/Cell) × (Moles/6.02E23 Molecules)
As explained in Tech Note 229 KinExA Analysis (TN229), it is necessary to resolve the expression level (EL) in order to resolve the Kd. Running two curves, with at least a 5 fold difference in spacing will usually result in resolving the expression level as well as the Kd. It is twice as much work as setting up a single curve but it reduces the chance that the experiment will fail to resolve either the Kd or expression level. Note that when setting up both curves, it is important that the cells be harvested from the same culture and at the same time to avoid discrepancies in expression from passage to passage.
In some cases, such as low expression levels or weak Kds, it may not be possible to use a high enough concentration of cells to define the lower plateau (NSB) of the system. In this case it may be possible to substitute an NSB point measured with zero primary antibody. In order to give accurate results this method requires at least two curves both of which must include points that are at least 20% inhibited. There must also be adequate separation between the curves, which generally requires a five fold or greater difference in the CBP concentrations. This two curve approach is still a good idea even if the Titrant will be used for the concentration reference. Figure 2 displays a simulated system with the minimum requirements met for the Kd and EL to be valid.
In cases where complete inhibition cannot be achieved, the signal from the NSB sample can be a substitute for the inhibited points. Make sure to include NSB in the timing setup. It may be necessary to un-ignore that point during the analysis.
The NSB sample can be sample buffer with cells only or just sample buffer (NSB contains no CBP). We have conducted in house research and found that using the NSB signal in place of a saturating cell concentration gave comparable results, although with somewhat greater uncertainty. Slight variations in the NSB signal also reported insignificant changes to the measured Kd and EL (always within the true 95% confidence interval bounds). If there is any question the cells may contribute to the NSB signal then cells only can be used to obtain your NSB signal.

Figure 2. A simulated system that resolved the Kd and EL even though the amount of cells required to fully inhibit the CBP were not present.
Whole Cell Analysis References
1. Rathanaswami, P., Babcook, J., Gallo, M. 2008. High-affinity binding measurements of antibodies to cell-surface-expressed antigens. Analytical Biochemistry 373(1): 52-60.
2. Xie, L., Jones, R.M., Glass, T.R., Navoa, R., Wang, Y., Grace, M.J. 2005. Measurement of the functional affinity constant of a monoclonal antibody for cell surface receptors using kinetic exclusion fluorescence immunoassay. Journal of Immunological Methods 304: 1-14.