
Technology Note 224
Linear Range
KinExA® Pro analysis operates under the assumption that signal is directly proportional to the free concentration of constant binding partner (CBP) in a sample. In actuality, the response is hyperbolic, but there is a range of CBP concentrations over which a linear assumption does not introduce significant error into measured Kd values. This tech note describes how to define a workable linear range and how much error to expect for experiments conducted both inside and outside the defined range.
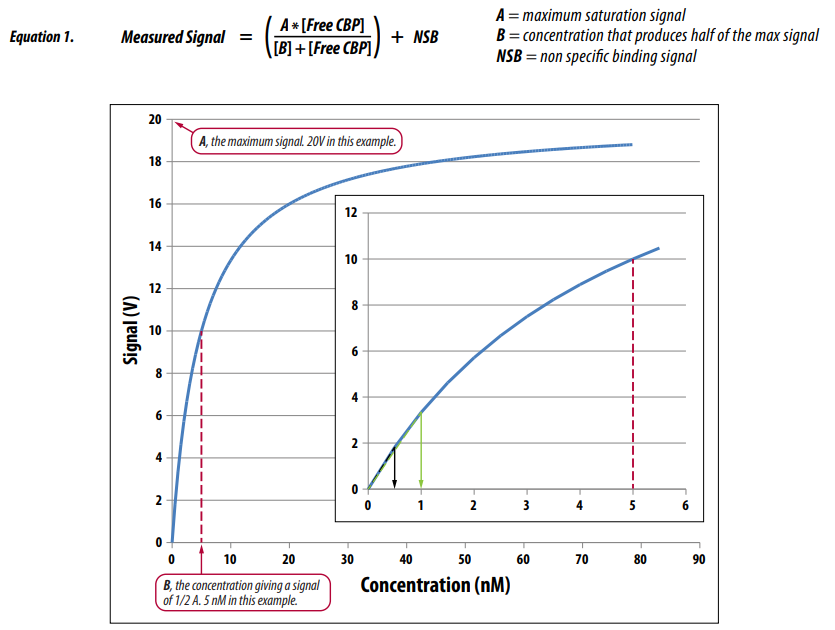
Every KinExA experiment in which the CBP is varied in the absence of titrant can be fit by a hyperbolic equation of the form shown in Equation 1.
Plotting Equation 1 using example values of A = 20V, B = 5 nM, and NSB = 0V gives the curved line shown in Figure 1. The curved line in Figure 1 represents the physically real situation in which the solid phase eventually saturates with bound CBP and cannot bind more. In the inset of Figure 1 the green and black arrows indicate potential “linear” concentration ranges of B/5 (10%) and B/10 (20%) respectively.
Visually, it seems unlikely that using either proposed linear range as an approximation for the blue hyperbolic response would result in a significant Kd error but we wanted a quantitative estimate of the actual error in Kd that would result.
To estimate the error in Kd, signals were simulated using the hyperbolic equation and analyzed using the standard KinExA Pro analysis with its built in linear assumption. The simulations (each conducted as a dual curve) were repeated with the CBP concentration of the simulated data representing different fractions of B. Results of the simulation are shown in Figure 2. The error bars indicate 95% confidence intervals (CI) and show that the true Kd (4 pM) is still included in the reported CI even at a CBP of 0.5*B.
Sapidyne personnel have used and promoted a rule of thumb of limiting the experiment maximum signal to 2 volts to keep in the linear range when using the red filter set. This guidance remains generally applicable but exceptions can occur. If you have unexpectedly low signals or any other reason to be suspicious a linearity check is quick and easy to perform.

Figure 2. Kd value reported when using CBP concentrations at various fractions of B. Shaded portion shows recommended range.
How to determine the linear binding range
If the linear binding range is unknown, a quick, 5 point, signal test can measure the usable linear range (use the concentration immunoassay experiment type when analyzing). Starting with the concentration you would like to use, prepare a sample 4x more concentrated and serially dilute by two fold for [4] total CBP samples plus [1] NSB sample. Once the hyperbolic curvature has been defined, experiments can be prepared that keep CBP concentrations within 20% for B. If the linear binding range is relatively small, this could be due to a poor solid phase capacity or extremely high capture percentage. To overcome these issues a different solid phase type may allow an increased capacity while a faster flow rate can reduce the capture percentage. If an experiment must be conducted with concentrations outside of the linear binding range the error can be corrected by submitting the sanitized .kxp file along with the hyperbolic signal test to a Sapidyne representative.