
Technology Note 236
Screening With KinExA®
The value of KinExA technology lies in its ability to measure low concentrations in solution, allowing accurate measurements of tight binding interactions under more physiologically relevant conditions. This gives researchers confidence in the affinity and kinetic values they use to guide drug development.
KinExA has primarily been used for final lead candidate selection or to confirm results from molecules prescreened with another, higher throughput, instrument. Use of KinExA in early screening has been limited due to the instrument’s throughput. While assay time can vary, a dual-curve analysis for a single binding pair typically takes about [10] hours. Screening multiple candidates at this pace would be prohibitively expensive in the early stages of drug discovery. As more drug candidates demonstrate very tight binding interactions, at or beyond the limits of other instruments, the need to use KinExA earlier in the screening process becomes increasingly important.
The screening capability of KinExA was first demonstrated in Kielczewska et al. 2022 (Figure 1)1. Screening was conducted with a panel of [10] antibodies against a soluble cytokine. Antibody was incubated with and without cytokine and the inhibited free fraction was calculated for each sample. The inhibited free fraction is also known as the Screening Ratio. A lower ratio correlates to a tighter binding affinity.
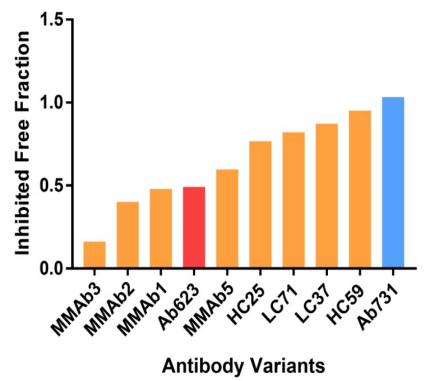
Figure 1. Kielczewska et al. 2022, supplemental figure 4.
In Erasmus et al. 2023 the SPR-based Carterra LSA and KinExA were used to measure the affinities of [48] antibodies generated against the SARS-CoV-2 receptor-binding domain2. The same screening methodology as Kielczewska et al. 2022 was used for KinExA measurements. The LSA and KinExA measurements showed a correlation, with KinExA Kds being generally tighter.
Erasmus et al. 2023 additionally demonstrated that the results of single point screening with KinExA typically correlate to the traditional KinExA equilibrium method. This ensures that the rank order will be accurate, despite the small sample set used to estimate Kd. When the KinExA traditional equilibrium method is used following the initial screen, a higher degree of accuracy and precision is provided, especially among molecules with tight binding affinities.
Most recently, the screening capability of KinExA has been successfully used to screen over [100] antibodies for the AIntibody competition3. This challenge tested the higher degree of throughput and the correlations suggested in Erasmus et al. 2023. The results of this challenge were congruent with the results from Erasmus et al. 2023, where the reported Kd using KinExA was tighter than what was seen from LSA and showed excellent agreement with fully characterized antibodies.
Based on the early work from researchers in conjunction with Sapidyne Instruments, a new version of KinExA software has been developed to include support for screening. This approach makes it possible to rank-order more antibodies in a reasonable time frame, reducing both measurement time and overall cost.
Measurement Details:
This screening experiment uses two samples for each Constant Binding Partner (CBP):
- Sig100 – CBP alone
- Inhibited – CBP with the binding partner (Inhibitor)
Non-specific binding (NSB) controls are included at both the beginning and end of the run. Samples may be prepared and analyzed in a single experiment or run separately. When put together in the n-Curve analysis, the full dataset can be combined to generate a comprehensive rank order, as shown in Figure 2.

Figure 2. Rank order n-Curve example.
The equation used to rank the CBPs is:
The CBPs are placed in rank order based on the Screening Ratio. The lower ratios are the tighter binding CBPs. Based on this ratio, an estimated Kd is provided. However, it is recommended to follow up with equilibrium and kinetics experiments after the ranking to get the most accurate data.
The optimal Inhibitor concentration depends on the estimated binding affinity (Kd). As a guideline, the CBP concentration should be five-fold lower than the Inhibitor to reduce variability from CBP activity. In the latest KinExA Pro software, the screening template includes a Theory Curve to help determine the best parameters for setup.
Before performing the screening it is recommended to perform a signal test using the desired assay format, CBP concentration, and the desired volume. The signal test can use the parent antibody, the reference, or utilize a randomly chosen candidate. Refer to Screening Experiment Preparation (HG279) for more instructions on sample and experiment preparation.
References:
1. Kielczewska, A., et al. (2022). Development of a potent high-affinity human therapeutic antibody via novel application of recombination signal sequence–based affinity maturation. Journal of Biological Chemistry, 298(2), 101533. https://doi.org/10.1016/j.jbc.2021.101533
2. Erasmus MF, Dovner M, Ferrara F, D’Angelo S, Teixeira AA, Leal-Lopes C, Spector L, Hopkins E, Bradbury ARM. Determining the affinities of high-affinity antibodies using KinExA and surface plasmon resonance. MAbs. 2023 Jan-Dec;15(1):2291209. doi: 10.1080/19420862.2023.2291209. Epub 2023 Dec 13. PMID: 38088807; PMCID: PMC10793667.
3. Erasmus, M.F., Spector, L., Ferrara, F. et al. AIntibody: an experimentally validated in silico antibody discovery design challenge. Nat Biotechnol 42, 1637–1642 (2024). https://doi.org/10.1038/s41587-024-02469-9