
Technology Note 229
KinExA® Analysis
When using KinExA Pro software to analyze data, only one binding partner’s concentration can be specified. The other concentration is calculated as part of the analysis and is reported as a percent activity. This is done to improve the accuracy of the reported Kd as described below.
Although it is common to have the nominal concentration of both binding partners, the actual active concentrations of the materials are often different than the nominal “known” concentration – sometimes substantially so. This is important because if there is any error in the active concentration of either binding partner, any analysis based on these incorrect concentrations will force the calculated Kd to be incorrect. In KinExA analysis one of the binding partners is specified as the concentration reference, and the other partner’s activity is calculated as part of the analysis. The Kd determination is then tied to the accuracy of the referenced binding partner concentration. Using this approach, the Kd will be as accurate as the reference concentration, which is better than the error when specifying both partner concentrations.
For example, Table 1 shows the results of analyzing the same data 3 different ways: Using the Titrant as the reference; using the CBP as the reference, or specifying the concentration of both binding partners. The analysis in KinExA Pro software will allow you to choose either the Titrant or the CBP as the reference concentration, but will not allow you to specify both. In Table 1 you can see that there is a 3.5 fold difference in the active versus the nominal concentration in one of the binding partners. If you choose the Titrant as the reference the CBP is 28.6% active (3.5 fold low), and if the CBP is the reference the Titrant is 350% active (3.5 fold high). In this situation the likely choice would be to use the Titrant as the reference because a low activity is much more likely than an activity of 350%. Plausible causes for a low activity include protein misfolding, insufficient purification, or a miscalculation in the nominal CBP concentration.
| Kd (pM) | Activity | Residual Error | Factor Change in Kd | |
|---|---|---|---|---|
| Titrant Specified | 2.47 | CBP = 28.6% | 1.37% | Assumed Correct |
| CBP Specified | 8.64 | Titrant = 350% | 1.37% | 3.5 |
| Both Specified | 0.08 | Both Assumed 100% | 15.0% | 30.8 |
Depending on the choice of concentration reference the Kd also differs by 3.5 fold, since there is a 3.5 fold difference in the reference concentrations. However, if the same measured data is analyzed with both binding partners specified then the factor change in Kd is much larger (30.8 fold vs 3.5 fold). The residual error is also greatly increased and there is no way to assess the activity of either binding partner since both are assumed to be 100%.
In the KinExA Analysis, the binding partner that is specified will depend on which one you trust more. If you are not sure, then look at the reported activity and decide if the result is reasonable. If the activity reflects over 100%, then specifying the other partner may be more appropriate.
Analysis Details
Although the choice of which binding partner to use as the concentration reference is determined by which concentration is more trusted, there is a peculiarity when using the CBP as the concentration reference. This peculiarity shows up when analyzing a Kd controlled curve, and neither the Kd or Titrant activity are well defined. Simply switching the concentration reference will give narrow bounds on the Kd.
To understand why this occurs, consider the analysis of the Kd controlled curve shown in Figures 1 and 2. Figure 1 shows the analysis when using the Titrant as the reference, notice the Kd value is well resolved with both upper and lower bounds for the CI. The CBP however is only partially resolved with only an upper bound on the CI. This is as expected since a fully Kd controlled curve has very little concentration information, see TN220 Theory Curve for more explanation of this.
The surprise comes when choosing the CBP as the reference and neither the Kd or the CBP activity is resolved. To understand this first look back at Figure 1. For a low ratio Kd controlled curve, such as this, the Kd value is approximately equal to the concentration giving 50% free Ab. In Figure 1 the x axis, showing the Titrant concentration, is fixed and unvariable. This means the Kd value can be, approximately, read from the axis. From the shape of the curve we can be sure the CBP is far less than the Kd but whether it is one hundred times less or one hundred million times less is not discernible. We can be sure from the shape of the curve that it is not equal to or greater than the Kd which enables the analysis to put an upper bound on the CI.
Figure 2 shows exactly the same data but in this case, the Titrant activity (i.e. the x-axis) is unknown, and is to be determined as part of the analysis. We still know from the curve shape that the Kd is far greater than the now fixed and unvariable CBP but we still don’t know how far. The axis value at the 50% point of the curve could be 10, 100 or 1e6 times above the CBP but we can’t tell which. The only thing we can be sure of is the Kd cannot be equal to or lower than the CBP value, allowing the analysis to put a lower bound on both the Kd and Titrant activity.
Figure 3 is the n-curve analysis which includes the curve from Figure 2 and a second experiment using a higher CBP concentration to define the X axis. Analyzed on the n-curve analysis, this resolves the Titrant activity and gives tighter bounds for both the Titrant activity and the Kd.

Figure 1. Experimental data indicates a Kd controlled curve when analyzed with the Titrant as the concentration reference.
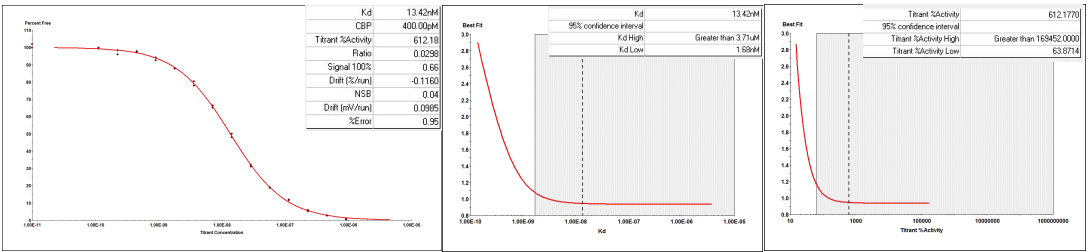
Figure 2. The same experimental data from Figure 1 measured with the CBP as the concentration reference.
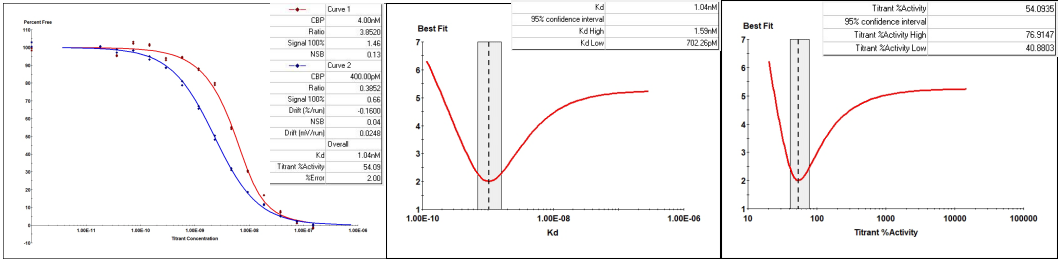
Figure 3. N-curve analysis data with the curve from Figure 2 and an additional experiment at a higher constant concentration.