Newsletter #6

KinExA® 4000
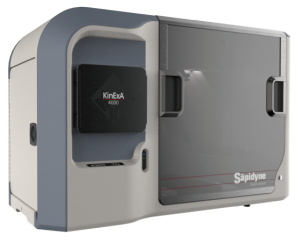 The next generation of KinExA instruments arrives in the 4th quarter of 2017. The KinExA 4000 will be able to characterize molecules with high affinity and slow off rates, measure native cells, engineered cells, small molecules, unmodified molecules, and molecules in unpurified sample matrices with femtomolar sensitivity
Features
- LED lamp with a 10 year warranty
- Smaller footprint
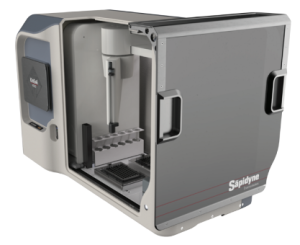
- An enclosed sample area that prevents outside contamination and collisions with the sipper tube
- Liquid level sensors that alert you to low buffer volume and high waste levels
- Simplified plumbing with lower maintenance costs
- Updated KinExA Pro software that makes analysis simple with one click giving you access to FDA 21 CFR Part 11 compliant data
Including Measured NSB in your Analysis
When making measurements to whole cells, a low cellular expression and a weak Kd it may be impossible to fully inhibit the constant binding partner (CBP). This results in a failure to be able to resolve the Kd and expression level (EL). In KinExA Pro software version 4.2.12 and newer we have added the ability to include a measured NSB point in the analysis, which dramatically improves the range of Kd and expression levels that can be resolved.
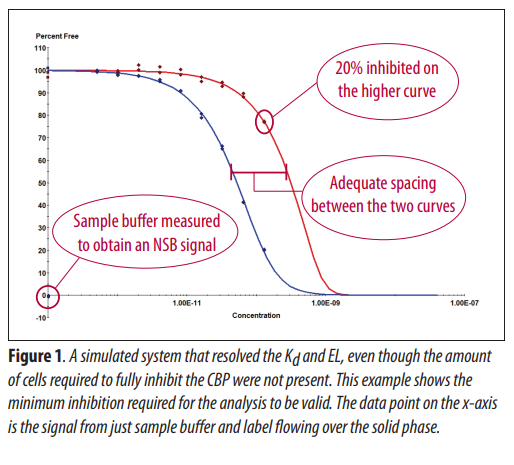
In order for this extrapolation to work, you must: 1) have at least two curves 2) inhibit at least 20% of the higher ratio curve (Figure 1), and 3) measure an NSB point using just sample buffer or sample buffer with only cells, no CBP. Once two or more curves have been measured and added to an n-curve analysis, make sure the NSB points are specified as NSB in the Cells/mL column on the Binding Signals tab, and click analyze.
It is important to note that the two curves need to be separated, not laying on top of one another. As a general rule, CBP values 5 fold apart should be adequate and easily seen in the data. Figure 1 shows an example of a dual curve analysis that displays all of the desired qualities for the extrapolated analysis to be valid.
Our in-house research found that using the NSB signal in place of a saturating cell concentration gives comparable results, although with somewhat greater uncertainty. Slight variations in the NSB signal also reported insignificant changes to the measured Kd and EL (always within the true 95% confidence interval bounds).
Reference Spotlight
In a recent 2017 publication, researchers used the KinExA platform to accurately determine the equilibrium dissociation constants for S1P (lipid) binding to an antibody and to serum albumin simultaneously.
This paper showcases a new KinExA technique to overcome challenges in measuring and interpreting data from protein-lipid interactions. As is mentioned in the paper, the kinetic exclusion assay (KinExA®) is presented as a compelling alternative to SPR-based techniques for determining equilibrium dissociation constants of protein-ligand interactions. It is described as especially useful for observing protein-lipid interactions, as binding of native lipids occurs entirely in solution, and monoclonal antibodies can be used to directly compete with a protein of interest for lipid binding.
For a detailed description of the method, refer to the reference below.
Fleming JK, Wojciak JM. 2017. Measuring Sphingosine-1-Phosphate: Protein Interactions with the Kinetic Exclusion Assay. Methods Mol Biol. 10.1007/7651_2017_5. https://www.ncbi.nlm.nih.gov/pubmed/28349502
Tips & Tricks
Queue Cleaning Templates
Obtaining clean data is a constant goal when running experiments. Working with sticky systems, however, can result in material buildup in the instrument lines leading to less than desirable results. To combat this issue, typically the buffer would need to be replaced with cleaning solution and rinsed multiple times, or a custom experiment template would need to be made to rinse the instrument without replacing the buffer.
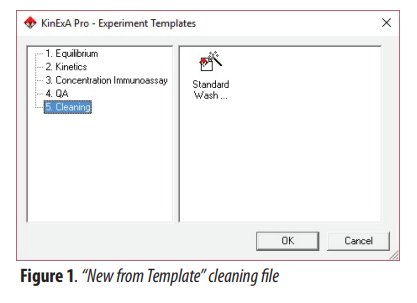
To streamline the process of cleaning, software versions 4.2.13 and newer now incorporate a cleaning file template that can be used between or after experiments (Figure 2). This is particularly useful when multiple experiments need to be run consecutively. Adding cleaning experiments into the queue can significantly reduce build up of sticky materials in the flow cell and lines.
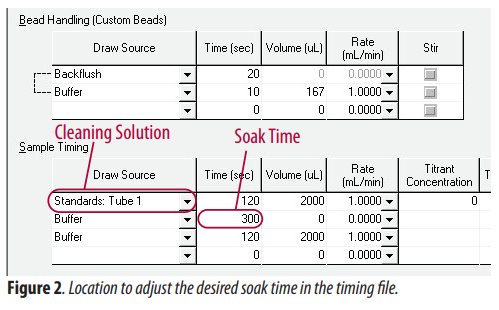
The template defaults to [5] cycles of a 300 second soak in cleaning solution (Figure 3). This is a reasonable starting point though users may find they need more or can get by with less depending on the particular system under study. This new template can be used with the KinExA instrument or Autosampler.