KinExA Pro Software
A robust tool for analyzing bimolecular interactions from data generated with KinExA instruments. Easy to use software in conjunction with powerful data analysis helps users interpret and understand the binding behavior of potential candidates, saving time and increasing confidence in the resulting conclusions. To prevent data errors and the integrity of the software, only data from KinExA instrumentation is valid when using KinExA Pro Software.
Single Click Analysis
|
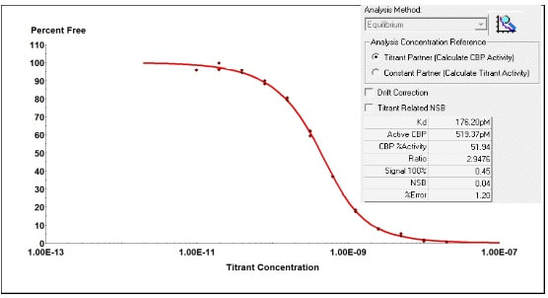
With a single click, exact solutions to the binding equations are used to fit a theoretical binding curve to experimental data. Along with affinity and kinetic constants, the following information can also be determined:
|
|
95% Confidence Intervals
|
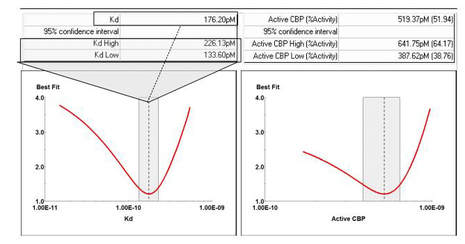
95% confidence intervals are generated simultaneously with binding curves. These graphical representations show how well certain parameters (such as the equilibrium dissociation constant, activity, and/or copy number) are defined.
With any system, noise and NSB contribute to uncertainty for a given measurement resulting in answers with similar residual error. Ideally, graphs have a narrow range of possible values that fit the data with low error, providing researchers a quick visual on how well their parameters are defined. |
|
N-Curve Analysis
|
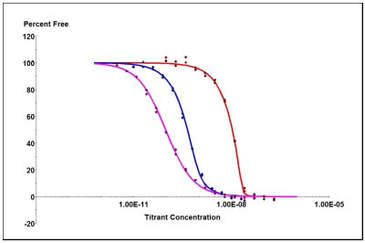
By including curves at varying concentrations, an additional parameter of spacing is incorporated into the global analysis. This helps to exploit discrepancies in the binding behavior. Non standard binding analysis, such as cooperativity, is also provided with a single click.
|
|
Theoretical Binding Curve
|
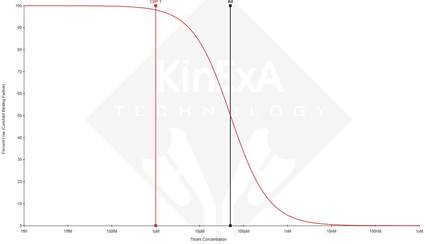
The Theoretical Binding Curve (Theory Curve), is an interactive tool created and maintained by Sapidyne Instruments Inc. The Theory Curve is based on the reversible binding equation (equation 1), describing the binding between two molecules in solution. As such, the Theory Curve illustrates the binding in solution independent of any particular measurement method.
|

|
This is a useful tool to aide in experiment setup and design, including information regarding the time needed to reach equilibrium. The full version, with multiple modeling scenarios, is incorporated into the KinExA Pro Software. This free version has limited modeling features but is still a very powerful tool to help understand binding behavior under various experimental conditions.
FDA 21 CFR Part 11 Compatible
If you have specific needs regarding compliance and your laboratory does not provide it's own compliance framework, Sapidyne Instruments offers customized solutions to meet your specific needs.
The KinExA 4000 & 3200 offer several specific features that are intended to address validation concerns,
We offer preventative maintenance agreements (PMAs) to our customers and Performance Qualifications (PQs), Installation Qualifications (IQs), and Operational Qualifications (OQs) of the instrument and component systems.
The KinExA 4000 & 3200 offer several specific features that are intended to address validation concerns,
- Flow Cell Camera (validation of bead pack with live video and image capture for each run)
- Pressure Transducer (validation of plumbing system via pressure diagnostics)
- Internal Data Storage (all experimental data is stored internally to provide a secure backup)
- Internal Instrument Controller (autonomous instrument operation)
We offer preventative maintenance agreements (PMAs) to our customers and Performance Qualifications (PQs), Installation Qualifications (IQs), and Operational Qualifications (OQs) of the instrument and component systems.